This page was generated from
docs/Examples/Fitting_Fermi_Diads/Example1b_CO2_Fluid_inclusions_withstandards/Step3b(optional)_Secondary_Peaks.ipynb.
Interactive online version:
![]() .
.
3b. Fitting carbonate and SO\(_2\) peaks
This notebook shows how to fit secondary peaks, such as carbonate and S-rich phases in vapour bubbles and fluid inclusions
[21]:
import numpy as np
import pandas as pd
import matplotlib.pyplot as plt
import DiadFit as pf
from tqdm import tqdm
pf.__version__
[21]:
'1.0.1'
[22]:
# Here, we are loading in the settings files from Step1. If all you want to do is find secondary phases, paste that code here
meta_path, spectra_path, spectra_filetype, prefix, str_prefix, spectra_file_ext, meta_file_ext, TruPower=pf.get_settings()
[23]:
exclude_str=['Ne', 'NE', 'Si', 'nodiad', 'Spec', 'CRR', 'secphase']
Diad_Files=pf.get_files(path=spectra_path, file_ext=spectra_file_ext, exclude_str=exclude_str)
print(Diad_Files)
File_df=pd.DataFrame(data={'filename': Diad_Files})
['02 FG04_A1_4_start.txt', '03 M58_c26_a1_FIA_crazySO2.txt', '05 M58_c25_a1_FIA.txt', '06 M58_c1_a1_FIA.txt', '07 M58_c1_a2_FIB.txt', '09 M58_c2_a1_FIA.txt', '10 M58_c3_a1_FIA.txt', '11 M58_c4_a1_FIA.txt', '13 M58_c6_a1_FIB.txt', '14 M58_c7_a1_FIA.txt', '15 M58_c9_a1_FIA.txt', '17 M58_c10_a1_FIA.txt', '18 M58_c11_a1_FIA.txt', '19 M58_c12_a1_FIA.txt', '21 M58_c13_a1_FIA.txt', '22 M58_c13_a2_FIB.txt', '23 M58_c13_a2_FIC.txt', '24 M58_c14_a1_FIA.txt', '25 M58_c14_a1_FIB.txt', '27 M58_c16_a1_FIA.txt', '28 M58_c16_a1_FIB.txt', '29 M58_c17_a1_FIA.txt', '30 M58_c19_a1_FIA.txt', '32 M58_c20_a1_FIA.txt', '33 M58_c23_a1_FIA.txt', '34 M58_c24_a1_FIA.txt', '35 FG04_A1_4_end.txt']
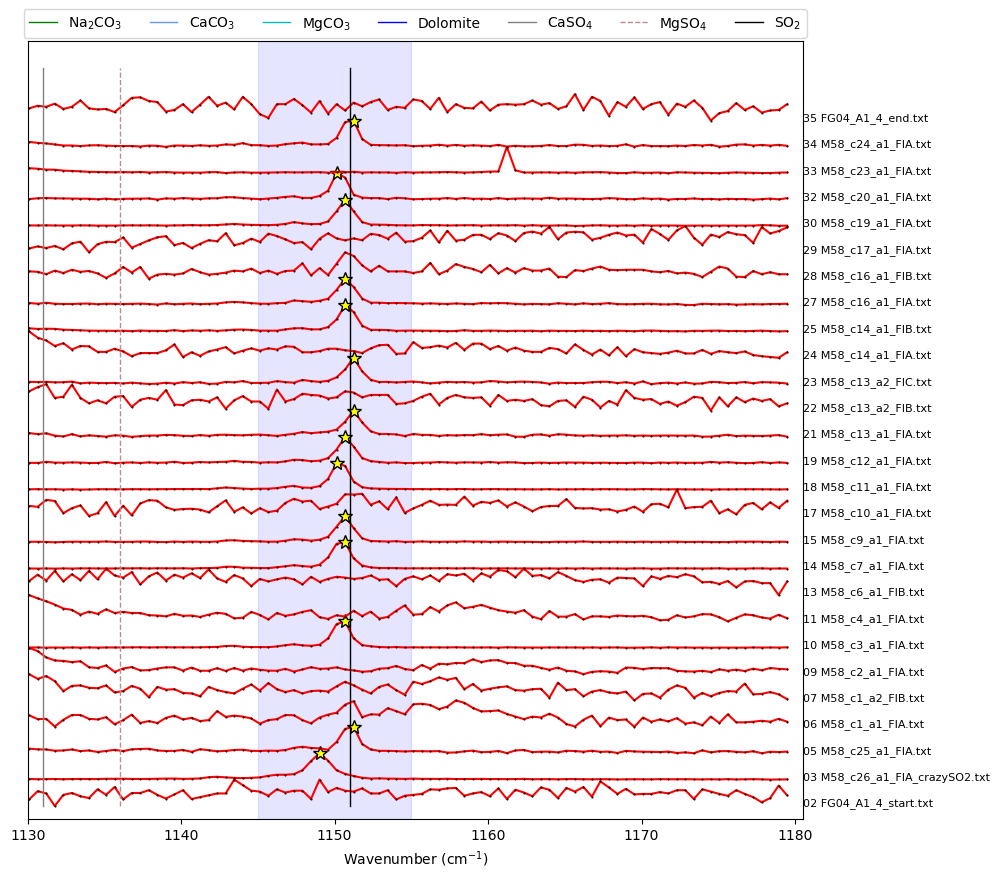
Plot spectra in a given region of space to examine secondary peaks or not
You’ll need to tweak the peak parameters to find them
height = minimum height a peak should have to be identified
threshold = required vertical distance between a peak and its neighbours
distance = required horizontal distance bewteen neighbouring peaks.
prominence = required prominence of peaks
width = width of peaks
Example 1 - Using Scipy find peaks to look for SO2
[24]:
prominence_SO2=20
height_SO2=20
width_SO2=1
threshold_SO2=1

SO2_peaks_scipy, x_data_scipy, y_data_scipy, fig_scipy=pf.plot_secondary_peaks(
Diad_Files=Diad_Files, path=spectra_path,
filetype=spectra_filetype, find_peaks_filter=True,
xlim_peaks=[1145, 1155], xlim_plot=[1130, 1180], yscale=0.3,
prominence=prominence_SO2, height=height_SO2, width=width_SO2, threshold=threshold_SO2)

SO2_peaks=SO2_peaks_scipy
[25]:
SO2_peaks
[25]:
| pos | height | prom | file_names | |
|---|---|---|---|---|
| 0 | NaN | NaN | NaN | 02 FG04_A1_4_start.txt |
| 1 | 1149.012212 | 1139.00 | 433.333343 | 03 M58_c26_a1_FIA_crazySO2.txt |
| 2 | 1151.234085 | 723.75 | 48.250000 | 05 M58_c25_a1_FIA.txt |
| 3 | NaN | NaN | NaN | 06 M58_c1_a1_FIA.txt |
| 4 | NaN | NaN | NaN | 07 M58_c1_a2_FIB.txt |
| 5 | NaN | NaN | NaN | 09 M58_c2_a1_FIA.txt |
| 6 | 1150.678702 | 1160.50 | 476.375000 | 10 M58_c3_a1_FIA.txt |
| 7 | NaN | NaN | NaN | 11 M58_c4_a1_FIA.txt |
| 8 | NaN | NaN | NaN | 13 M58_c6_a1_FIB.txt |
| 9 | 1150.678702 | 1165.50 | 475.500000 | 14 M58_c7_a1_FIA.txt |
| 10 | 1150.678702 | 842.00 | 177.625000 | 15 M58_c9_a1_FIA.txt |
| 11 | NaN | NaN | NaN | 17 M58_c10_a1_FIA.txt |
| 12 | 1150.123263 | 1121.50 | 434.375000 | 18 M58_c11_a1_FIA.txt |
| 13 | 1150.678702 | 872.50 | 188.375000 | 19 M58_c12_a1_FIA.txt |
| 14 | 1151.234085 | 780.75 | 90.875000 | 21 M58_c13_a1_FIA.txt |
| 15 | NaN | NaN | NaN | 22 M58_c13_a2_FIB.txt |
| 16 | 1151.234085 | 756.00 | 72.750000 | 23 M58_c13_a2_FIC.txt |
| 17 | NaN | NaN | NaN | 24 M58_c14_a1_FIA.txt |
| 18 | 1150.678702 | 884.25 | 204.125000 | 25 M58_c14_a1_FIB.txt |
| 19 | 1150.678702 | 822.50 | 136.000000 | 27 M58_c16_a1_FIA.txt |
| 20 | NaN | NaN | NaN | 28 M58_c16_a1_FIB.txt |
| 21 | NaN | NaN | NaN | 29 M58_c17_a1_FIA.txt |
| 22 | 1150.678702 | 1154.00 | 445.125000 | 30 M58_c19_a1_FIA.txt |
| 23 | 1150.123263 | 772.00 | 99.750000 | 32 M58_c20_a1_FIA.txt |
| 24 | NaN | NaN | NaN | 33 M58_c23_a1_FIA.txt |
| 25 | 1151.234085 | 879.50 | 136.000000 | 34 M58_c24_a1_FIA.txt |
| 26 | NaN | NaN | NaN | 35 FG04_A1_4_end.txt |
Now filter out ones with no peaks, or low prominence before we loop through them
[26]:
# Remove the ones where it didnt find SO2
SO2_notNa=np.isnan(SO2_peaks['pos'])
# Remove ones with a prominence less than this.
prom_filt=10
SO2_filter=((SO2_peaks['prom']>10))&(~SO2_notNa)
print('Number kept with this filter:')
print(sum(SO2_filter))
print('Number discarded:')
print(sum(~SO2_filter&(~SO2_notNa)))
filenames_SO2=list(File_df['filename'].loc[SO2_filter])
print('filenames with SO2:')
print(filenames_SO2)
Number kept with this filter:
14
Number discarded:
0
filenames with SO2:
['03 M58_c26_a1_FIA_crazySO2.txt', '05 M58_c25_a1_FIA.txt', '10 M58_c3_a1_FIA.txt', '14 M58_c7_a1_FIA.txt', '15 M58_c9_a1_FIA.txt', '18 M58_c11_a1_FIA.txt', '19 M58_c12_a1_FIA.txt', '21 M58_c13_a1_FIA.txt', '23 M58_c13_a2_FIC.txt', '25 M58_c14_a1_FIB.txt', '27 M58_c16_a1_FIA.txt', '30 M58_c19_a1_FIA.txt', '32 M58_c20_a1_FIA.txt', '34 M58_c24_a1_FIA.txt']
Choose a filename to test peak fits
[27]:
if sum(SO2_filter)>0:
    filename=filenames_SO2[0]
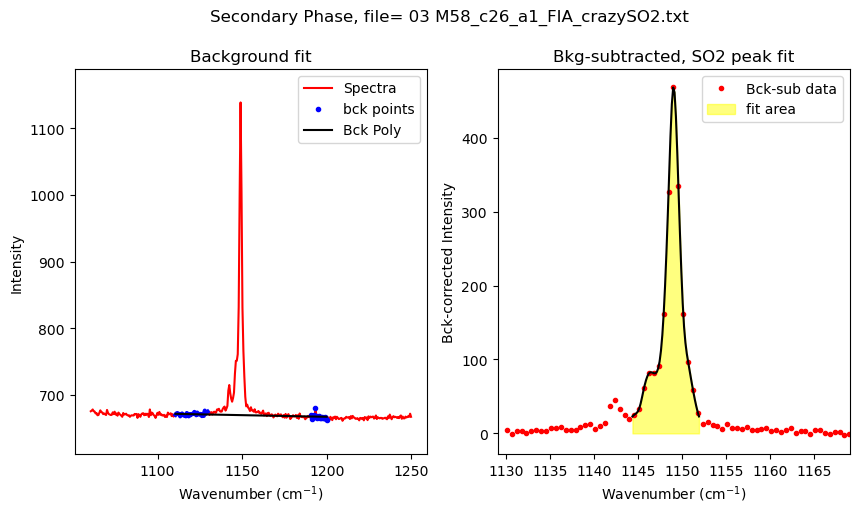
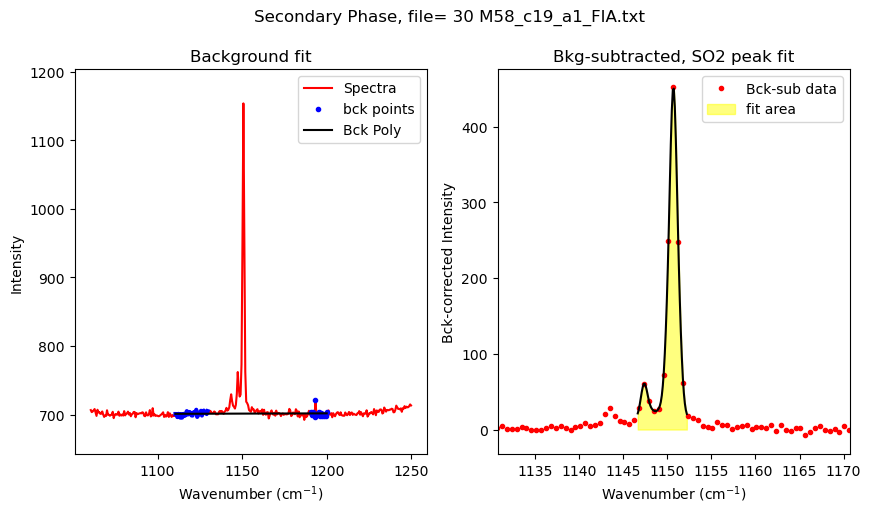
Set up configuration file for S peak fitting
Here, we are using a spline to quantify the area down to the 92% of the peak height (int_cut_of=0.08), there are differen options you can use for this
[28]:
if sum(SO2_filter)>0:
    SO2_peak_config=pf.generic_peak_config(name='SO2', lower_bck=[1110, 1130],
    upper_bck=[1190, 1200], cent=1150, x_range_bck=20, N_peaks=1,   model_name='Spline', int_cut_off=0.05)
    print(SO2_peak_config)

    SO2_peak_fit=pf.fit_generic_peak(config=SO2_peak_config,
    path=spectra_path, filename=filename, filetype=spectra_filetype,
     plot_figure=True)
generic_peak_config(name='SO2', lower_bck=[1110, 1130], upper_bck=[1190, 1200], model_name='Spline', x_range_bck=20, N_poly_carb_bck=1, amplitude=1000, cent=1150, outlier_sigma=12, distance=10, prominence=5, width=6, threshold=0.1, height=100, exclude_range=None, return_other_params=False, N_peaks=1, int_cut_off=0.05)

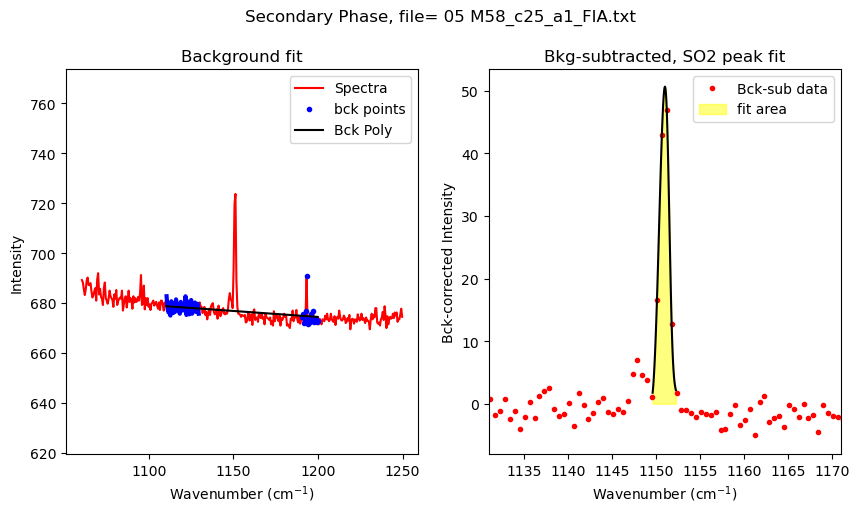
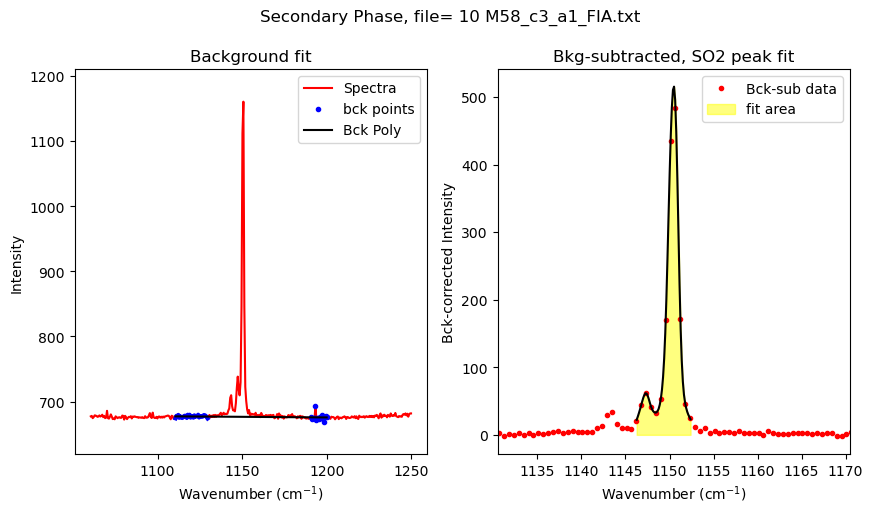
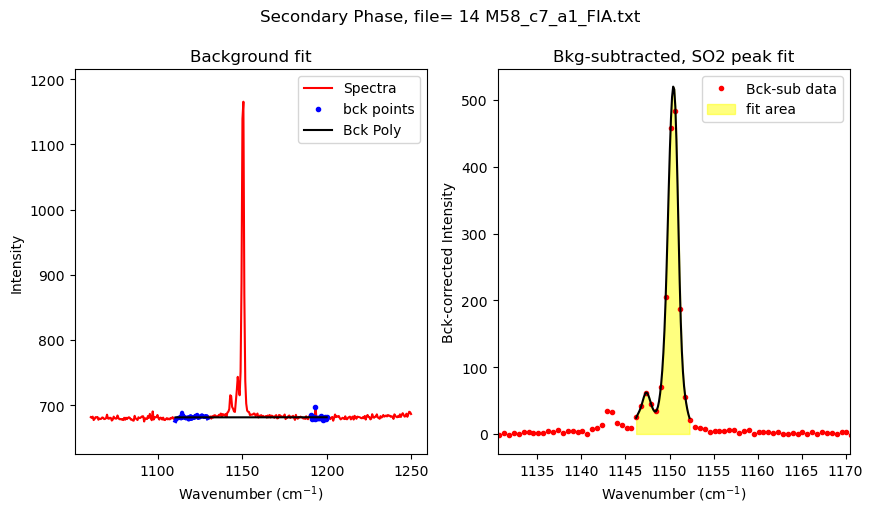
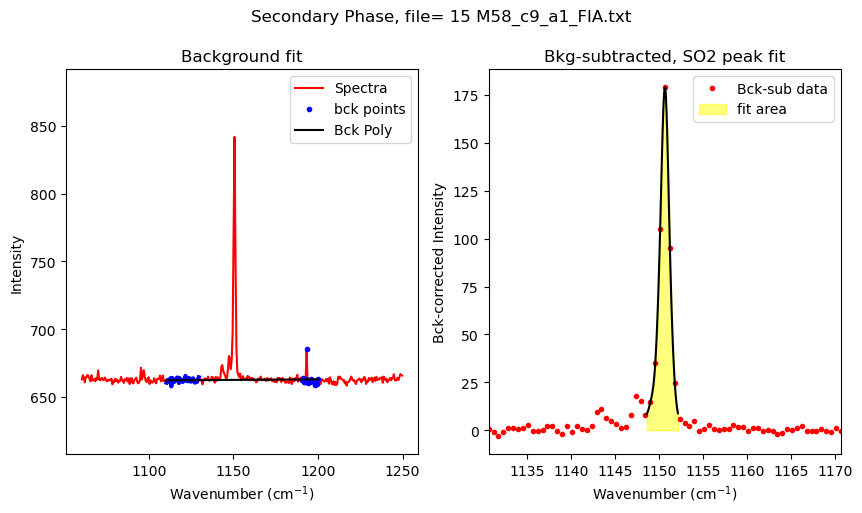
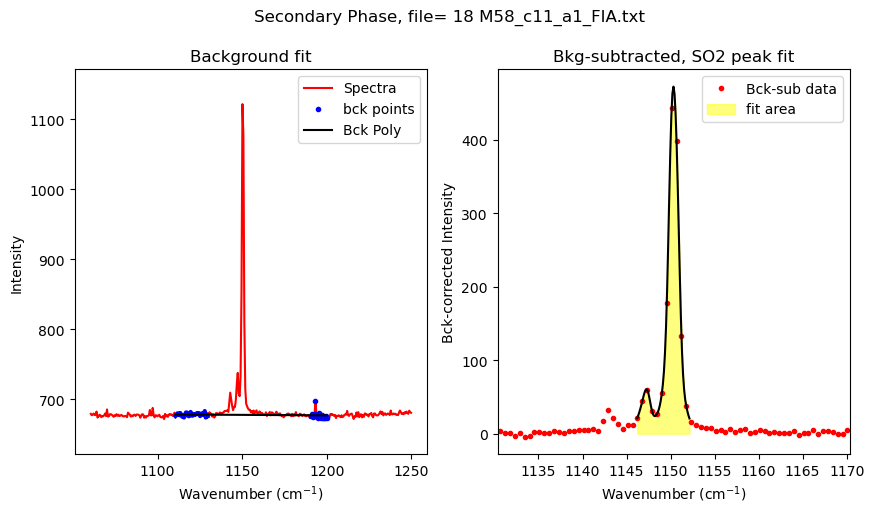
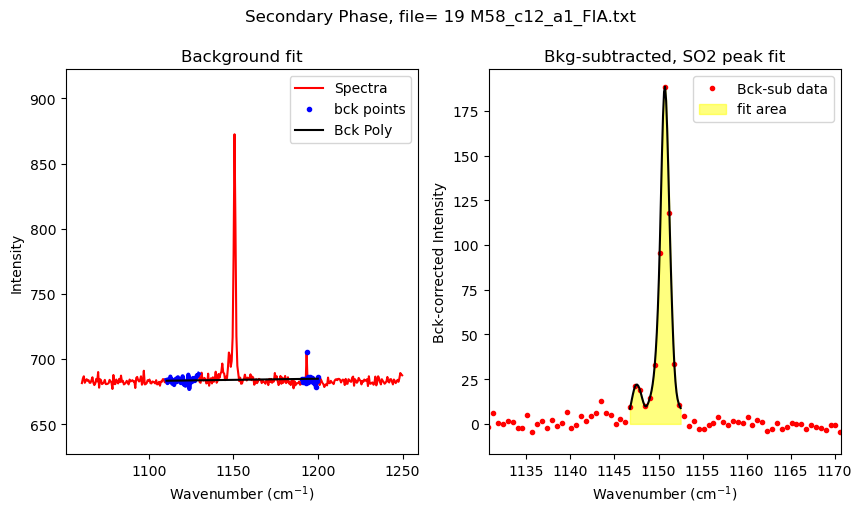
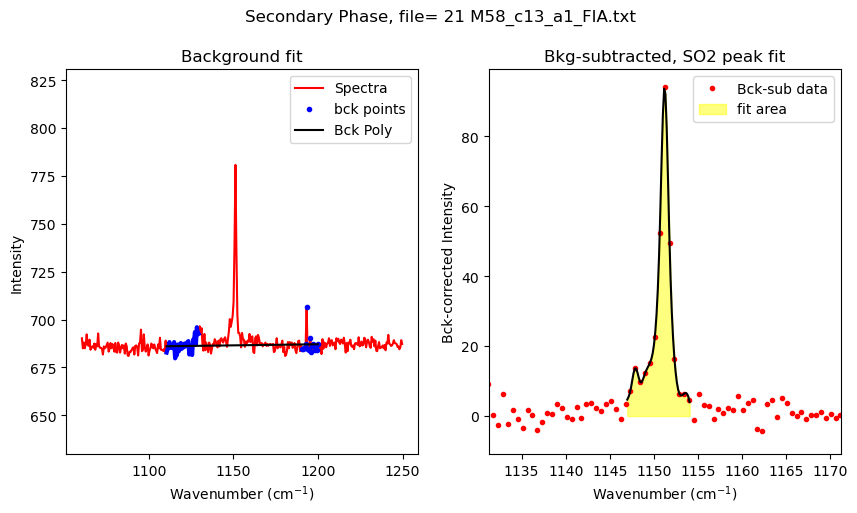
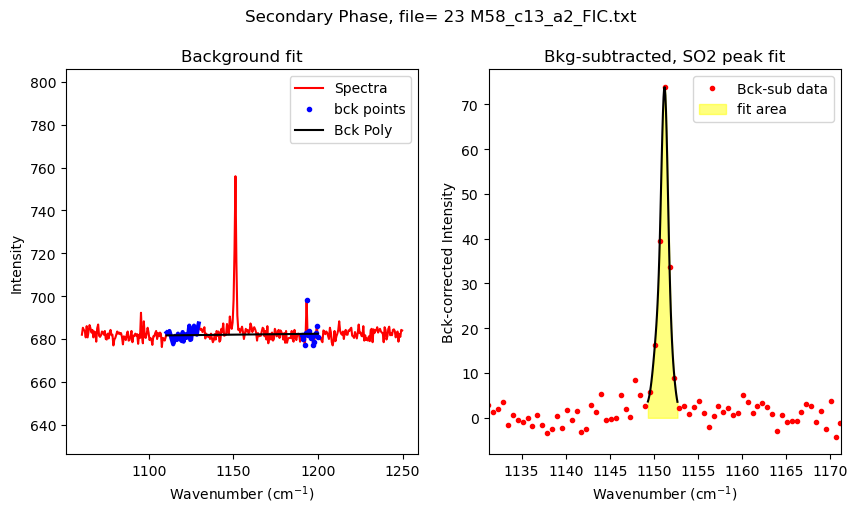
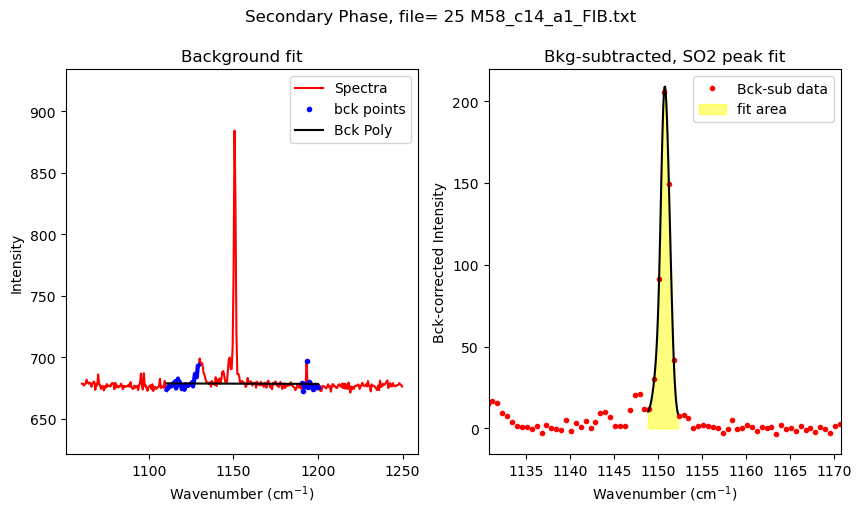
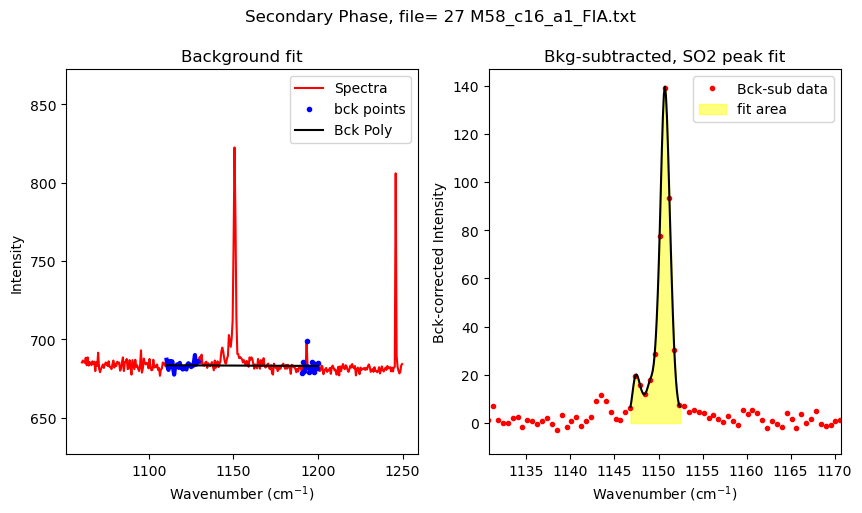
Now lets loop through files
[29]:
files_to_fit=filenames_SO2
plot_figure=True # If False, Means doesnt have to make figures, lot faster.
close_figure=False # Means shows figures in the notebook itself

df_Merge_SO2 = pd.DataFrame([])

for i in tqdm(range(0, len(files_to_fit))): #

    ## Diad 1 fit
    filename=files_to_fit[i]

    SO2_peak_fit=pf.fit_generic_peak(config=SO2_peak_config,
path=spectra_path, filename=filename, filetype=spectra_filetype,
 plot_figure=plot_figure)

    df_Merge_SO2 = pd.concat([df_Merge_SO2, SO2_peak_fit], axis=0)
100%|██████████| 14/14 [00:03<00:00, 4.47it/s]
[30]:
df_Merge_SO2
[30]:
| filename | Peak_Cent_SO2 | Peak_Area_SO2 | Peak_Height_SO2 | Model_name | |
|---|---|---|---|---|---|
| 0 | 03 M58_c26_a1_FIA_crazySO2.txt | 1149.030202 | 1112.401486 | 469.145256 | Spline |
| 0 | 05 M58_c25_a1_FIA.txt | 1151.008207 | 67.116493 | 46.950902 | Spline |
| 0 | 10 M58_c3_a1_FIA.txt | 1150.468751 | 868.874777 | 483.977756 | Spline |
| 0 | 14 M58_c7_a1_FIA.txt | 1150.468751 | 925.798063 | 484.061645 | Spline |
| 0 | 15 M58_c9_a1_FIA.txt | 1150.648570 | 253.186154 | 179.436467 | Spline |
| 0 | 18 M58_c11_a1_FIA.txt | 1150.348872 | 789.813298 | 443.698952 | Spline |
| 0 | 19 M58_c12_a1_FIA.txt | 1150.708510 | 304.269304 | 188.482533 | Spline |
| 0 | 21 M58_c13_a1_FIA.txt | 1151.247966 | 172.246941 | 94.203448 | Spline |
| 0 | 23 M58_c13_a2_FIC.txt | 1151.247966 | 98.780289 | 73.965457 | Spline |
| 0 | 25 M58_c14_a1_FIB.txt | 1150.768449 | 295.125415 | 205.703794 | Spline |
| 0 | 27 M58_c16_a1_FIA.txt | 1150.708510 | 246.268625 | 139.228010 | Spline |
| 0 | 30 M58_c19_a1_FIA.txt | 1150.708510 | 700.272759 | 452.641323 | Spline |
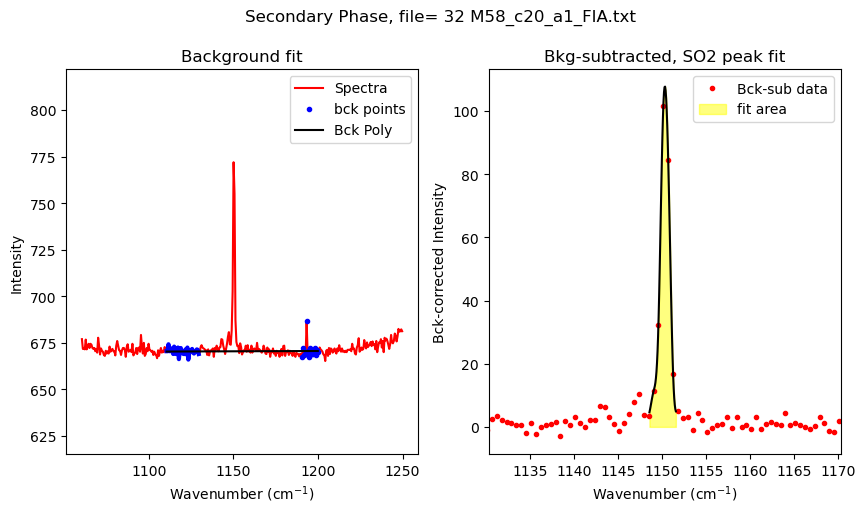
| 0 | 32 M58_c20_a1_FIA.txt | 1150.288933 | 137.918636 | 101.532433 | Spline |
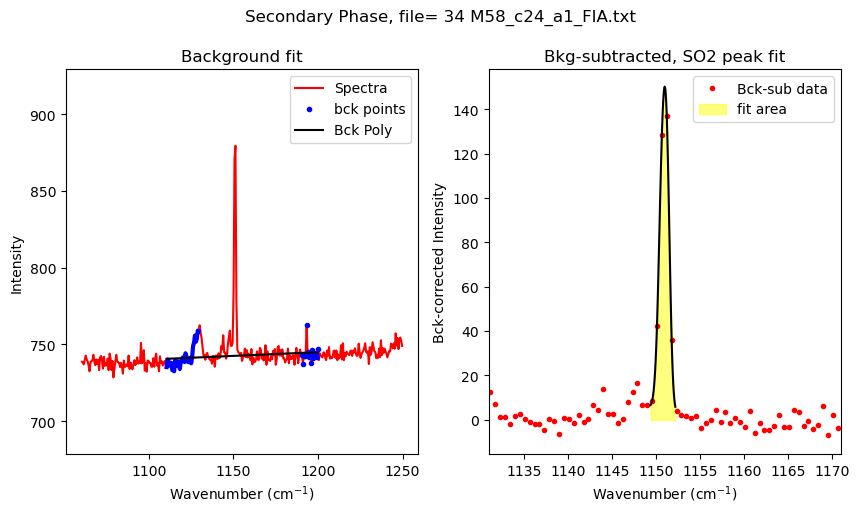
| 0 | 34 M58_c24_a1_FIA.txt | 1151.008207 | 195.765712 | 136.894437 | Spline |
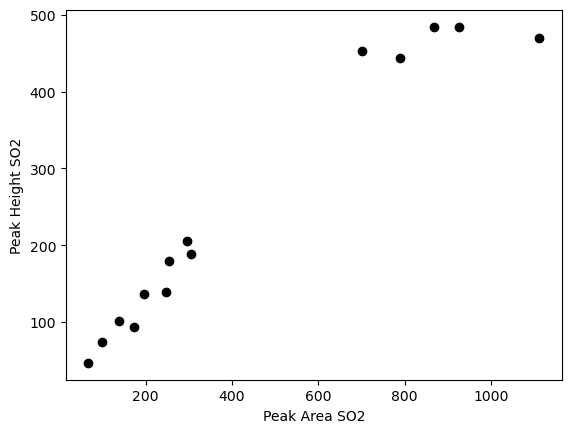
Plot peak areas and peak heights
[31]:
if sum(SO2_filter)>0:
    plt.plot(df_Merge_SO2['Peak_Area_SO2'],
            df_Merge_SO2['Peak_Height_SO2'], 'ok')
    plt.xlabel('Peak Area SO2')
    plt.ylabel('Peak Height SO2')
    # plt.yscale('log')
# plt.xscale('log')
Save this to excel
[32]:
if sum(SO2_filter)>0:
    df_Merge_SO2.to_excel('SO2_Peak_fits.xlsx', index=False)
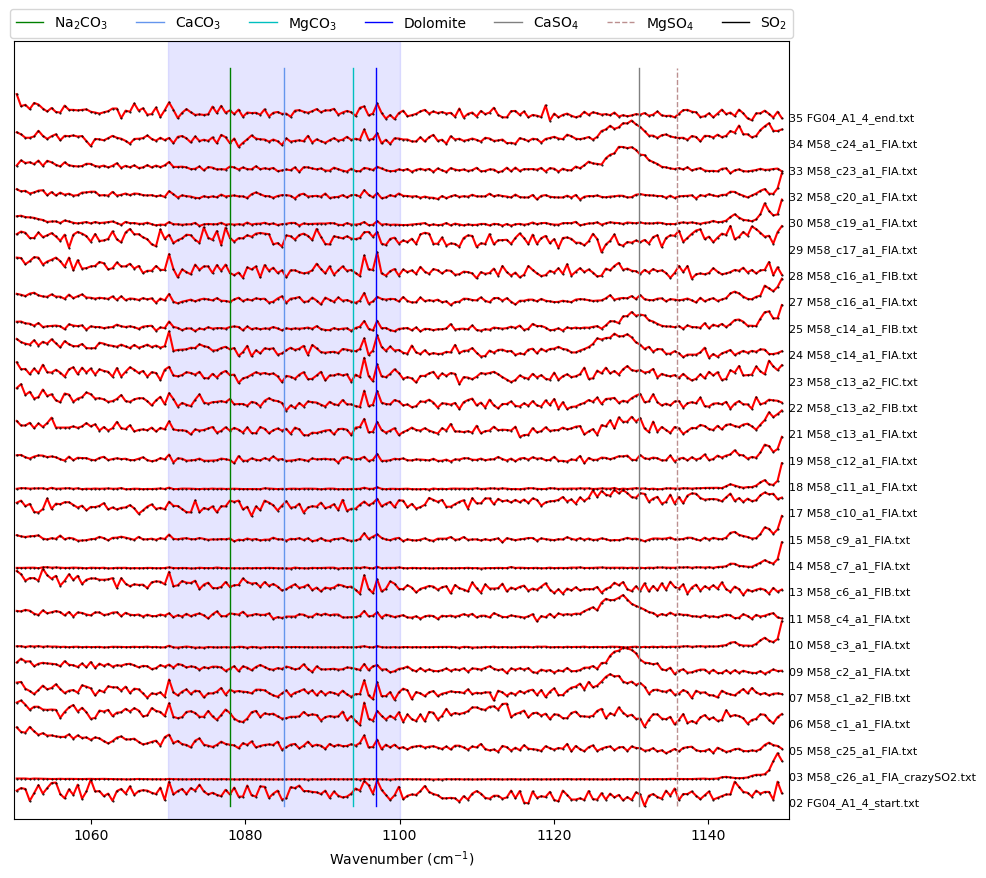
Now do the same to ID any carbonate peaks
Using scipy find peaks methods
This method doesnt always work perfectly for broader carbonate peaks
[33]:
prominence_carb=30
height_carb=10
width_carb=1
threshold_carb=1

Carb_peaks_scipy, x_data_scipy, y_data_scipy, fig=pf.plot_secondary_peaks(
Diad_Files=Diad_Files, path=spectra_path,
 filetype=spectra_filetype, find_peaks_filter=True,
xlim_plot=[1050, 1150], xlim_peaks=[1070, 1100], yscale=0.3,
prominence=prominence_carb, height=height_carb, width=width_carb, threshold=threshold_carb)
Carb_peaks=Carb_peaks_scipy

[34]:
prominence_carb=30
height_carb=10
width_carb=1
threshold_carb=1

Carb_peaks_prom, x_data_prom, y_data_prom, fig=pf.plot_secondary_peaks(
Diad_Files=Diad_Files, path=spectra_path,
 filetype=spectra_filetype, prominence_filter=True,
xlim_plot=[1050, 1150], xlim_peaks=[1070, 1100], yscale=0.3,
prominence=prominence_carb, height=height_carb, width=width_carb, threshold=threshold_carb)
Find ones with certain peak parameters to include
[35]:
Carb_noNa=np.isnan(Carb_peaks['pos'])
prom_filter=30
Carb_filter=((Carb_peaks['prom']>prom_filter))&(~Carb_noNa)
print('Number kept with this filter:')
print(sum(Carb_filter))
print('Number discarded:')
print(sum(~Carb_filter&(~Carb_noNa)))
filenames_Carb=list(File_df['filename'].loc[Carb_filter])
print('filenames with carb:')
print(filenames_Carb)
Number kept with this filter:
0
Number discarded:
0
filenames with carb:
[]
Fit one to tweak parameters
[36]:
if sum(Carb_filter)>0:
    filename_carb=filenames_Carb[0]

    Carb_peak_config=pf.generic_peak_config(name='Carb', lower_bck=[1050, 1070],
    upper_bck=[1120, 1150], cent=1090, x_range_bck=50, N_poly_carb_bck=2, model_name='Spline')
    print(Carb_peak_config)

    Carb_peak_fit=pf.fit_generic_peak(config=Carb_peak_config,
    path=spectra_path, filename=filename_carb, filetype=spectra_filetype,
     plot_figure=True)
Loop over all carbonate files
[37]:
files_to_fit=filenames_Carb
plot_figure=True # If False, Means doesnt have to make figures, lot faster.
close_figure=False # Means shows figures in the notebook itself

df_Merge_Carb = pd.DataFrame([])

for i in tqdm(range(0, len(files_to_fit))): #

    ## Diad 1 fit
    filename=files_to_fit[i]

    Carb_peak_fit=pf.fit_generic_peak(config=Carb_peak_config,
path=spectra_path, filename=filename, filetype=spectra_filetype,
 plot_figure=plot_figure)

    df_Merge_Carb = pd.concat([df_Merge_Carb, Carb_peak_fit], axis=0)
0it [00:00, ?it/s]
[38]:
if sum(Carb_filter)>0:
    plt.plot(df_Merge_Carb['Peak_Area_Carb'],
        df_Merge_Carb['Peak_Height_Carb'], 'ok')
    plt.xlabel('Peak Area Carb')
    plt.ylabel('Peak Height Carb')
# plt.yscale('log')
# plt.xscale('log')
Save to excel
[39]:
if sum(Carb_filter)>0:
    df_Merge_Carb.to_excel('Carb_Peak_fits.xlsx', index=False )
[40]:
df_Merge_Carb
[40]:
[ ]: