This page was generated from
docs/Examples/Fitting_Fermi_Diads/Example1b_CO2_Fluid_Inclusions_nostandards/Step3b(optional)_Secondary_Peaks.ipynb.
Interactive online version:
![]() .
.
3b. Fitting carbonate and SO\(_2\) peaks
This notebook shows how to fit secondary peaks, such as carbonate and S-rich phases in vapour bubbles and fluid inclusions
[1]:
import numpy as np
import pandas as pd
import matplotlib.pyplot as plt
import DiadFit as pf
from tqdm import tqdm
pf.__version__
[1]:
'1.0.0'
[2]:
# Here, we are loading in the settings files from Step1. If all you want to do is find secondary phases, paste that code here
meta_path, spectra_path, spectra_filetype, prefix, str_prefix, spectra_file_ext, meta_file_ext, TruPower=pf.get_settings()
[3]:
exclude_str=['Ne', 'NE', 'Si', 'nodiad', 'Spec', 'CRR', 'secphase']
Diad_Files=pf.get_files(path=spectra_path, file_ext=spectra_file_ext, exclude_str=exclude_str)
print(Diad_Files)
File_df=pd.DataFrame(data={'filename': Diad_Files})
['02 K23_10_FIA_50X.txt', '05 K23_1_FIA_50X.txt', '06 K23_1_FIA_50X_r2_longeraq.txt', '08 K23_2_FIA_50X.txt', '09 K23_2_FIB_50X.txt', '11 K23_2_FIC_50X.txt', '13 K23_4_FIA_50X.txt', '14 K23_4_FIB_50X.txt', '16 K23_6_FIA_50X.txt', '17 K23_7_FIA_50X.txt', '19 K23_7_FIB_50X.txt', '20 K23_7_FIC_50X.txt', '21 K23_9_FIA_50X.txt', '23 K23_101_FID_50X.txt', '24 K23_101_FIC_50X.txt', '26 K23_102_FIA.txt']
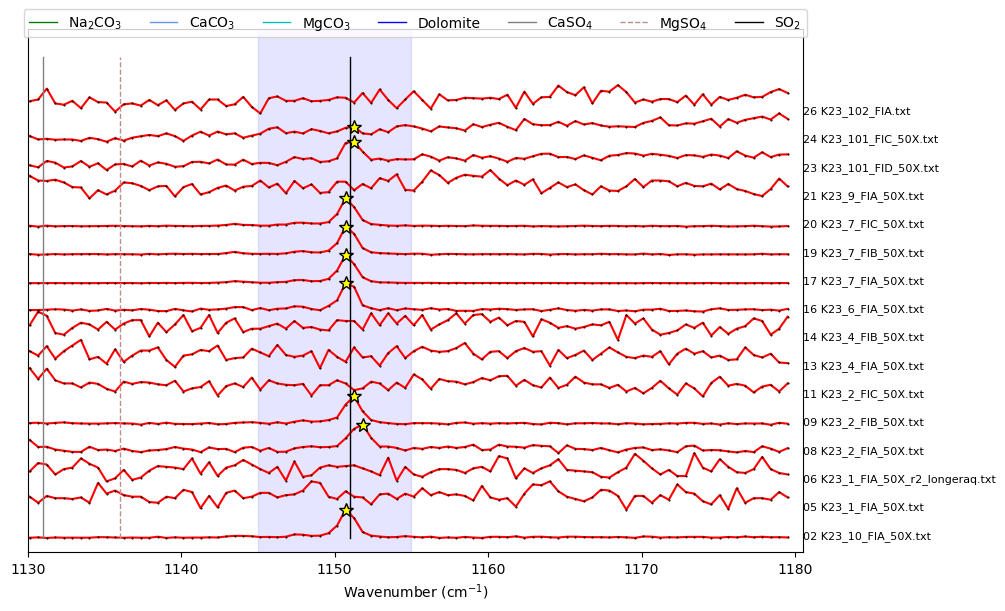
Plot spectra in a given region of space to examine secondary peaks or not
You’ll need to tweak the peak parameters to find them
height = minimum height a peak should have to be identified
threshold = required vertical distance between a peak and its neighbours
distance = required horizontal distance bewteen neighbouring peaks.
prominence = required prominence of peaks
width = width of peaks
Example 1 - Using Scipy find peaks to look for SO2
[4]:
prominence_SO2=20
height_SO2=20
width_SO2=1
threshold_SO2=1

SO2_peaks_scipy, x_data_scipy, y_data_scipy, fig_scipy=pf.plot_secondary_peaks(
Diad_Files=Diad_Files, path=spectra_path,
filetype=spectra_filetype, find_peaks_filter=True,
xlim_peaks=[1145, 1155], xlim_plot=[1130, 1180], yscale=0.3,
prominence=prominence_SO2, height=height_SO2, width=width_SO2, threshold=threshold_SO2)

SO2_peaks=SO2_peaks_scipy
[5]:
SO2_peaks
[5]:
| pos | height | prom | file_names | |
|---|---|---|---|---|
| 0 | 1150.710207 | 1352.750000 | 396.250 | 02 K23_10_FIA_50X.txt |
| 1 | NaN | NaN | NaN | 05 K23_1_FIA_50X.txt |
| 2 | NaN | NaN | NaN | 06 K23_1_FIA_50X_r2_longeraq.txt |
| 3 | 1151.820890 | 721.250000 | 26.250 | 08 K23_2_FIA_50X.txt |
| 4 | 1151.265577 | 819.750000 | 121.625 | 09 K23_2_FIB_50X.txt |
| 5 | NaN | NaN | NaN | 11 K23_2_FIC_50X.txt |
| 6 | NaN | NaN | NaN | 13 K23_4_FIA_50X.txt |
| 7 | NaN | NaN | NaN | 14 K23_4_FIB_50X.txt |
| 8 | 1150.710207 | 714.750000 | 47.000 | 16 K23_6_FIA_50X.txt |
| 9 | 1150.710207 | 1530.500000 | 834.875 | 17 K23_7_FIA_50X.txt |
| 10 | 1150.710207 | 912.666687 | 234.500 | 19 K23_7_FIB_50X.txt |
| 11 | 1150.710207 | 897.000000 | 217.125 | 20 K23_7_FIC_50X.txt |
| 12 | NaN | NaN | NaN | 21 K23_9_FIA_50X.txt |
| 13 | 1151.265577 | 1240.750000 | 65.625 | 23 K23_101_FID_50X.txt |
| 14 | 1151.265577 | 1544.250000 | 2.125 | 24 K23_101_FIC_50X.txt |
| 15 | NaN | NaN | NaN | 26 K23_102_FIA.txt |
Now filter out ones with no peaks, or low prominence before we loop through them
[6]:
# Remove the ones where it didnt find SO2
SO2_notNa=np.isnan(SO2_peaks['pos'])
# Remove ones with a prominence less than this.
prom_filt=10
SO2_filter=((SO2_peaks['prom']>10))&(~SO2_notNa)
print('Number kept with this filter:')
print(sum(SO2_filter))
print('Number discarded:')
print(sum(~SO2_filter&(~SO2_notNa)))
filenames_SO2=list(File_df['filename'].loc[SO2_filter])
print('filenames with SO2:')
print(filenames_SO2)
Number kept with this filter:
8
Number discarded:
1
filenames with SO2:
['02 K23_10_FIA_50X.txt', '08 K23_2_FIA_50X.txt', '09 K23_2_FIB_50X.txt', '16 K23_6_FIA_50X.txt', '17 K23_7_FIA_50X.txt', '19 K23_7_FIB_50X.txt', '20 K23_7_FIC_50X.txt', '23 K23_101_FID_50X.txt']
Choose a filename to test peak fits
[7]:
if sum(SO2_filter)>0:
    filename=filenames_SO2[0]
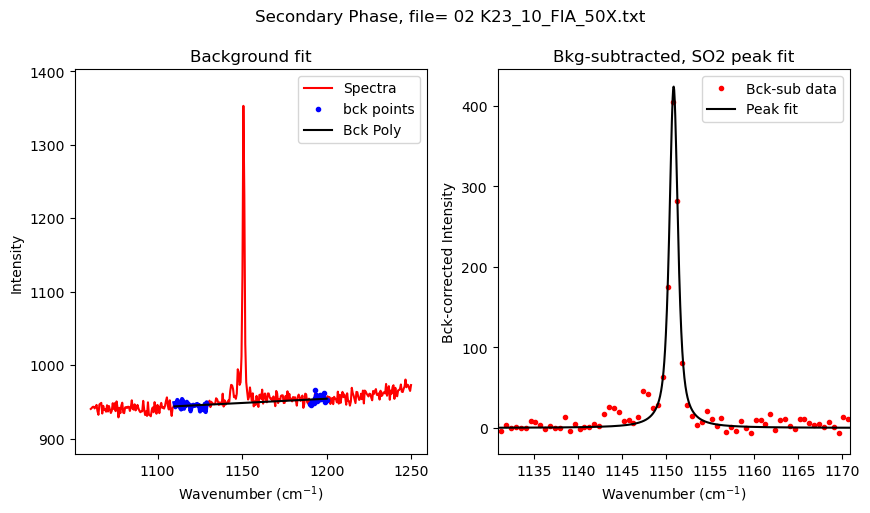
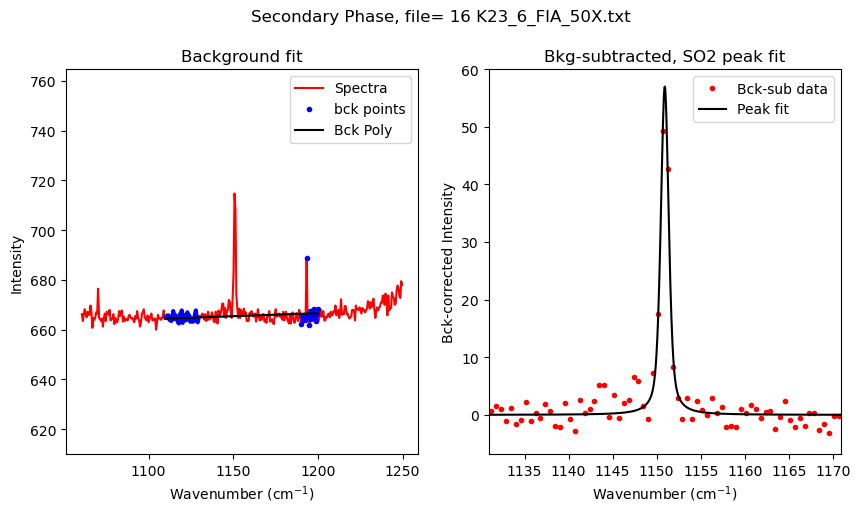
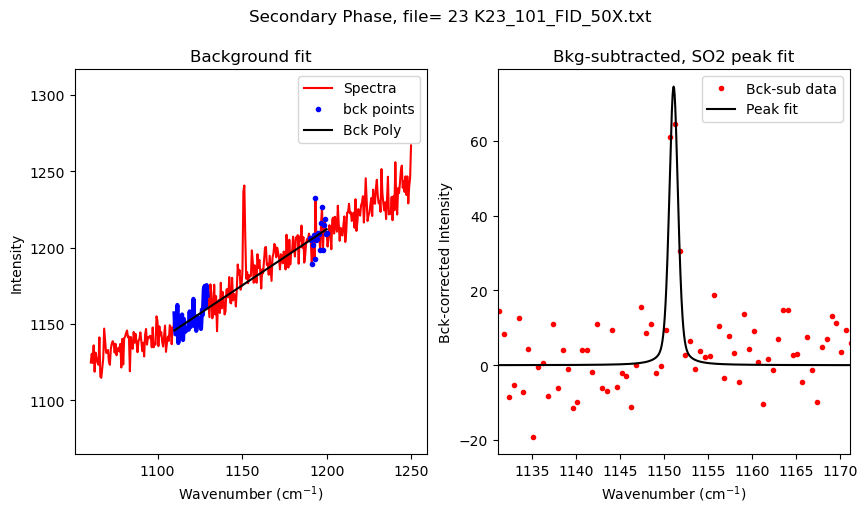
Set up configuration file for S peak fitting
Here, we are using a spline to quantify the area down to the 92% of the peak height (int_cut_of=0.08), there are differen options you can use for this
[8]:
if sum(SO2_filter)>0:
    SO2_peak_config=pf.generic_peak_config(name='SO2', lower_bck=[1110, 1130],
    upper_bck=[1190, 1200], cent=1150, x_range_bck=20, N_peaks=1,   model_name='PseudoVoigtModel', int_cut_off=0.05)
    print(SO2_peak_config)

    SO2_peak_fit=pf.fit_generic_peak(config=SO2_peak_config,
    path=spectra_path, filename=filename, filetype=spectra_filetype,
     plot_figure=True)
generic_peak_config(name='SO2', lower_bck=[1110, 1130], upper_bck=[1190, 1200], model_name='PseudoVoigtModel', x_range_bck=20, N_poly_carb_bck=1, amplitude=1000, cent=1150, outlier_sigma=12, distance=10, prominence=5, width=6, threshold=0.1, height=100, exclude_range=None, return_other_params=False, N_peaks=1, int_cut_off=0.05)

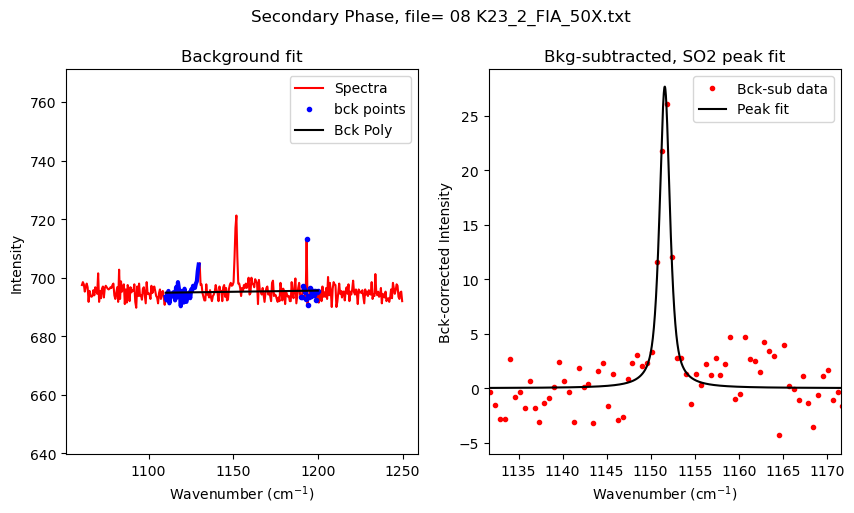
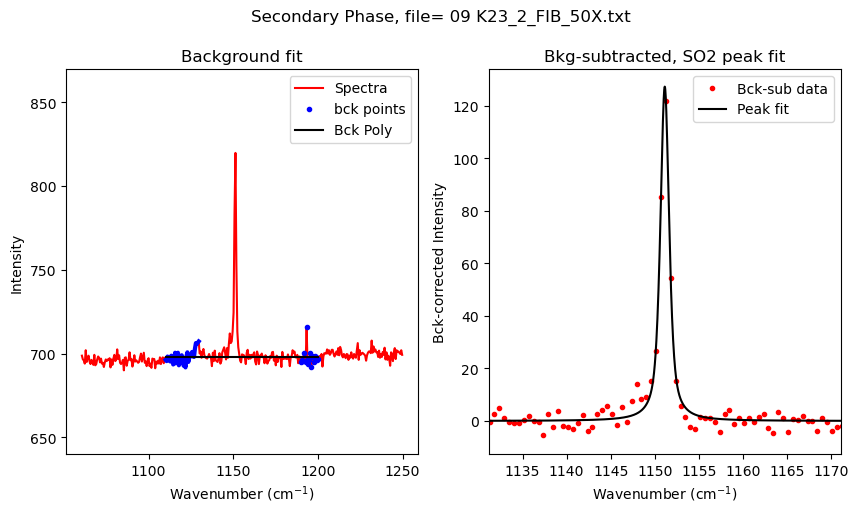
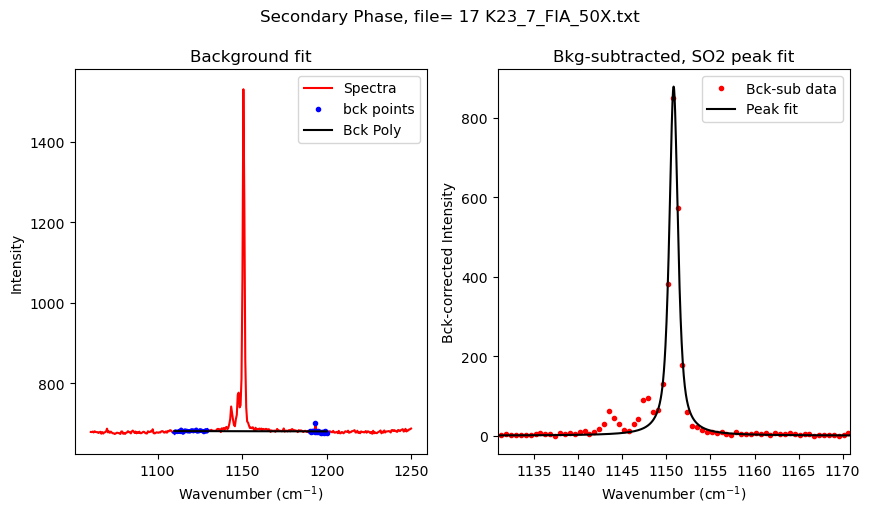
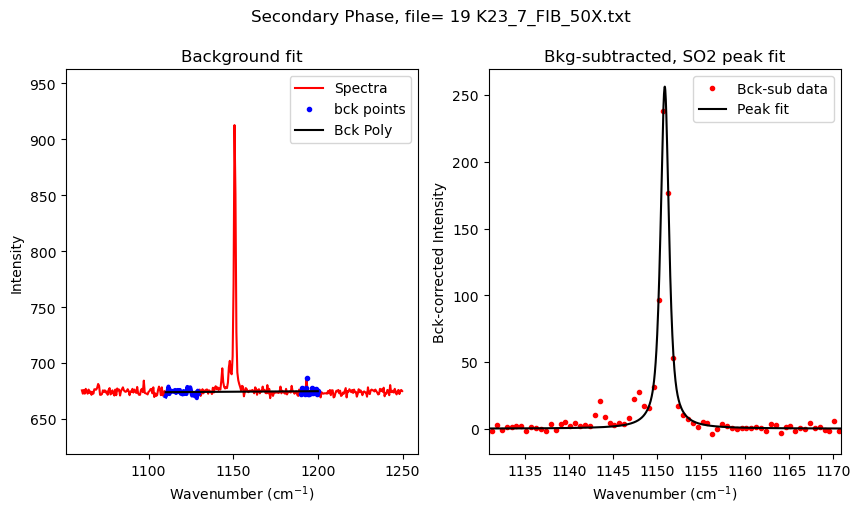
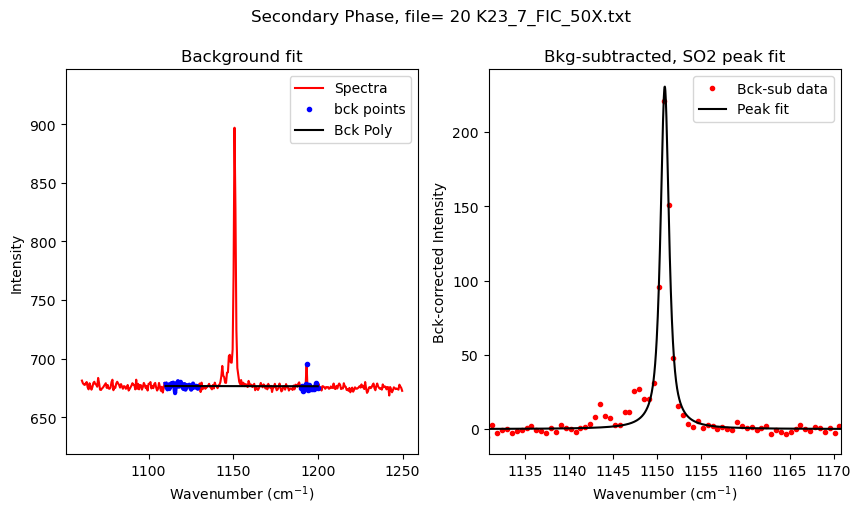
Now lets loop through files
[9]:
files_to_fit=filenames_SO2
plot_figure=True # If False, Means doesnt have to make figures, lot faster.
close_figure=False # Means shows figures in the notebook itself

df_Merge_SO2 = pd.DataFrame([])

for i in tqdm(range(0, len(files_to_fit))): #

    ## Diad 1 fit
    filename=files_to_fit[i]

    SO2_peak_fit=pf.fit_generic_peak(config=SO2_peak_config,
path=spectra_path, filename=filename, filetype=spectra_filetype,
 plot_figure=plot_figure)

    df_Merge_SO2 = pd.concat([df_Merge_SO2, SO2_peak_fit], axis=0)
100%|██████████| 8/8 [00:01<00:00, 4.39it/s]
[10]:
df_Merge_SO2
[10]:
| filename | Peak_Cent_SO2 | Peak_Area_SO2 | Peak_Height_SO2 | Model_name | |
|---|---|---|---|---|---|
| 0 | 02 K23_10_FIA_50X.txt | 1150.831826 | 704.823512 | 423.697480 | PseudoVoigtModel |
| 0 | 08 K23_2_FIA_50X.txt | 1151.598961 | 54.394056 | 27.661967 | PseudoVoigtModel |
| 0 | 09 K23_2_FIB_50X.txt | 1151.137480 | 210.893727 | 127.278631 | PseudoVoigtModel |
| 0 | 16 K23_6_FIA_50X.txt | 1150.918011 | 81.236734 | 56.991906 | PseudoVoigtModel |
| 0 | 17 K23_7_FIA_50X.txt | 1150.816103 | 1487.116475 | 878.750202 | PseudoVoigtModel |
| 0 | 19 K23_7_FIB_50X.txt | 1150.866055 | 415.186617 | 256.317384 | PseudoVoigtModel |
| 0 | 20 K23_7_FIC_50X.txt | 1150.829761 | 390.005271 | 230.468894 | PseudoVoigtModel |
| 0 | 23 K23_101_FID_50X.txt | 1151.072950 | 108.775452 | 74.499108 | PseudoVoigtModel |
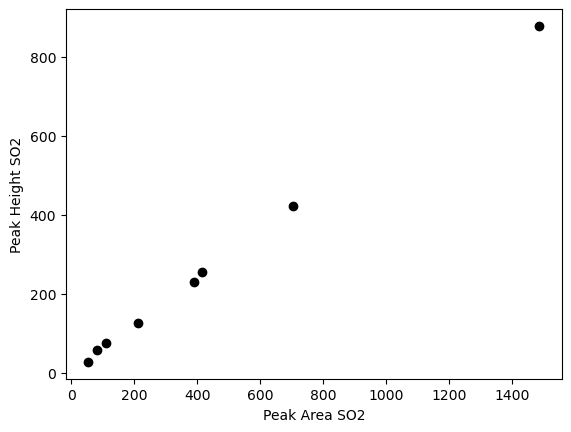
Plot peak areas and peak heights
[11]:
if sum(SO2_filter)>0:
    plt.plot(df_Merge_SO2['Peak_Area_SO2'],
            df_Merge_SO2['Peak_Height_SO2'], 'ok')
    plt.xlabel('Peak Area SO2')
    plt.ylabel('Peak Height SO2')
    # plt.yscale('log')
# plt.xscale('log')
Save this to excel
[12]:
if sum(SO2_filter)>0:
    df_Merge_SO2.to_excel('SO2_Peak_fits.xlsx', index=False)
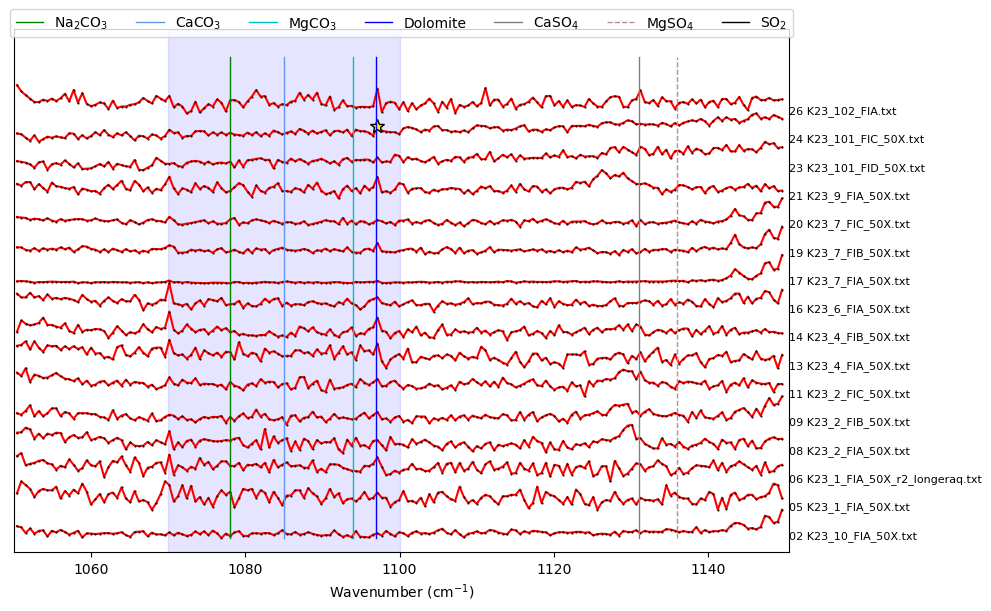
Now do the same to ID any carbonate peaks
Using scipy find peaks methods
This method doesnt always work perfectly for broader carbonate peaks
[13]:
prominence_carb=30
height_carb=10
width_carb=1
threshold_carb=1

Carb_peaks_scipy, x_data_scipy, y_data_scipy, fig=pf.plot_secondary_peaks(
Diad_Files=Diad_Files, path=spectra_path,
 filetype=spectra_filetype, find_peaks_filter=True,
xlim_plot=[1050, 1150], xlim_peaks=[1070, 1100], yscale=0.3,
prominence=prominence_carb, height=height_carb, width=width_carb, threshold=threshold_carb)
Carb_peaks=Carb_peaks_scipy
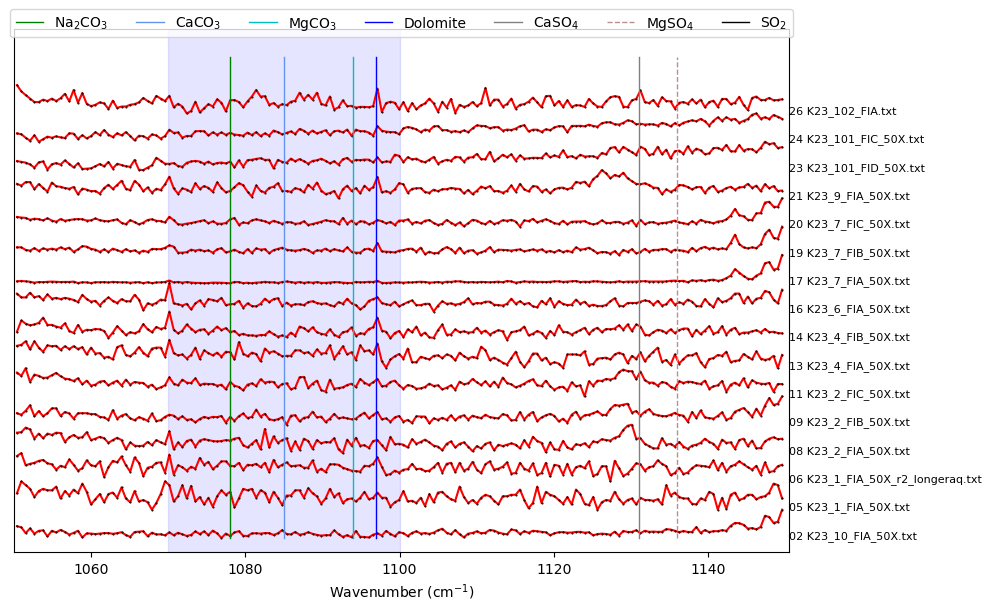
[14]:
prominence_carb=30
height_carb=10
width_carb=1
threshold_carb=1

Carb_peaks_prom, x_data_prom, y_data_prom, fig=pf.plot_secondary_peaks(
Diad_Files=Diad_Files, path=spectra_path,
 filetype=spectra_filetype, prominence_filter=True,
xlim_plot=[1050, 1150], xlim_peaks=[1070, 1100], yscale=0.3,
prominence=prominence_carb, height=height_carb, width=width_carb, threshold=threshold_carb)
Find ones with certain peak parameters to include
[15]:
Carb_noNa=np.isnan(Carb_peaks['pos'])
prom_filter=30
Carb_filter=((Carb_peaks['prom']>prom_filter))&(~Carb_noNa)
print('Number kept with this filter:')
print(sum(Carb_filter))
print('Number discarded:')
print(sum(~Carb_filter&(~Carb_noNa)))
filenames_Carb=list(File_df['filename'].loc[Carb_filter])
print('filenames with carb:')
print(filenames_Carb)
Number kept with this filter:
0
Number discarded:
1
filenames with carb:
[]
Fit one to tweak parameters
[16]:
if sum(Carb_filter)>0:
    filename_carb=filenames_Carb[0]

    Carb_peak_config=pf.generic_peak_config(name='Carb', lower_bck=[1050, 1070],
    upper_bck=[1120, 1150], cent=1090, x_range_bck=50, N_poly_carb_bck=2, model_name='Spline')
    print(Carb_peak_config)

    Carb_peak_fit=pf.fit_generic_peak(config=Carb_peak_config,
    path=spectra_path, filename=filename_carb, filetype=spectra_filetype,
     plot_figure=True)
Loop over all carbonate files
[17]:
files_to_fit=filenames_Carb
plot_figure=True # If False, Means doesnt have to make figures, lot faster.
close_figure=False # Means shows figures in the notebook itself

df_Merge_Carb = pd.DataFrame([])

for i in tqdm(range(0, len(files_to_fit))): #

    ## Diad 1 fit
    filename=files_to_fit[i]

    Carb_peak_fit=pf.fit_generic_peak(config=Carb_peak_config,
path=spectra_path, filename=filename, filetype=spectra_filetype,
 plot_figure=plot_figure)

    df_Merge_Carb = pd.concat([df_Merge_Carb, Carb_peak_fit], axis=0)
0it [00:00, ?it/s]
[18]:
if sum(Carb_filter)>0:
    plt.plot(df_Merge_Carb['Peak_Area_Carb'],
        df_Merge_Carb['Peak_Height_Carb'], 'ok')
    plt.xlabel('Peak Area Carb')
    plt.ylabel('Peak Height Carb')
# plt.yscale('log')
# plt.xscale('log')
Save to excel
[19]:
if sum(Carb_filter)>0:
    df_Merge_Carb.to_excel('Carb_Peak_fits.xlsx', index=False )
[20]:
df_Merge_Carb
[20]:
[ ]: